Land Use/Land Cover Mapping with Google Earth Engine
Large-scale Land Use/Land Cover classification built on Google Earth Engine, turning raw satellite imagery into actionable land-cover maps for environmental monitoring at regional scale.
Client: Environmental Research Lab (Confidential)
01 Overview
Classifying land cover across a large region by hand - digitizing boundaries, manually labeling parcels - simply doesn't scale. We built a Land Use/Land Cover (LULC) mapping pipeline on Google Earth Engine that applies machine learning classification directly to satellite imagery, producing consistent, regularly-updatable land cover maps across areas too large to review manually.
The pipeline pulls multi-spectral satellite imagery, applies preprocessing (cloud masking, atmospheric correction, index calculation for vegetation and water), and trains a classifier against labeled reference points to categorize land into classes - forest, cropland, urban, water, bare soil. Because it runs on Earth Engine's infrastructure, re-running the classification on updated imagery is a matter of re-triggering the pipeline, not repeating months of manual digitization.
The output feeds directly into the same PostGIS-backed systems used for other environmental monitoring work, so land-cover change over time becomes just another queryable layer rather than a one-off report.
02 The Challenge
Manual land-cover classification across a large study area was slow, inconsistent between reviewers, and impractical to repeat often enough to track meaningful change - each full classification cycle took far longer than the rate at which the land itself was changing.
03 Our Solution
We built an ML-based classification pipeline on Google Earth Engine that ingests multi-spectral satellite imagery, applies preprocessing and spectral index calculations, and classifies land cover against a trained reference model - producing a full-region map in a fraction of the time manual digitization required, and repeatably enough to track change over successive seasons.
04 Results & Impact
Project Details
- Category
- GIS & Geospatial
- Client
- Environmental Research Lab (Confidential)
Technologies Used
Related Projects
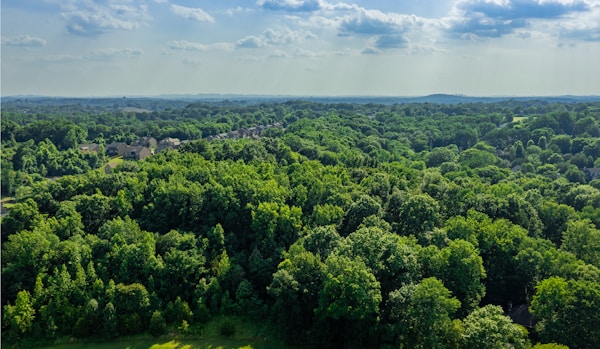
Forest Watch: Real-Time Deforestation Monitoring Dashboard
A real-time web dashboard that tracks forest cover change and flags deforestation hotspots as new satellite data arrives, replacing periodic manual review with continuous, automated monitoring.
Read case study →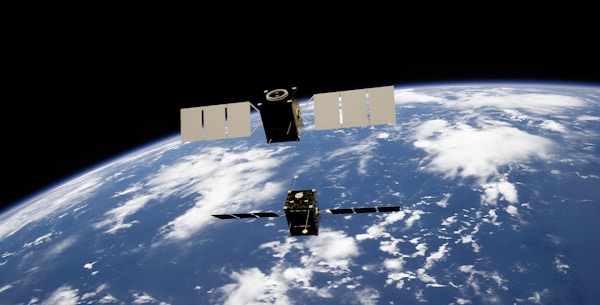
Geo-Forensics: Satellite Imagery Analysis for Policy Support
Geo-forensics analysis combining satellite imagery timelines with GIS overlays to give policymakers verifiable, ground-truthed spatial evidence rather than secondhand reports.
Read case study →
Eco Health Monitoring: Environmental Reporting Website
A public-facing environmental reporting website built for a European diplomatic mission, turning environmental health data management into an accessible, transparent public resource.
Read case study →