Forest Watch: Real-Time Deforestation Monitoring Dashboard
A real-time web dashboard that tracks forest cover change and flags deforestation hotspots as new satellite data arrives, replacing periodic manual review with continuous, automated monitoring.
Client: Environmental Research Lab (Confidential)
01 Overview
Forest cover loss is easy to miss when you're only checking in every few months - by the time a review cycle catches it, the damage is already done. We built Forest Watch to close that gap: a web dashboard that ingests satellite and remote-sensing data on an ongoing basis, compares it against historical baselines, and surfaces areas of change as soon as they appear, instead of waiting for a scheduled audit.
The dashboard is built around a straightforward loop: pull new imagery, run change detection against the stored baseline, store the results in a spatial database, and render the output as an interactive map with time-based filtering. Analysts can scrub through change history for any region, drill into a flagged area, and export findings without needing a desktop GIS application open.
The goal throughout was accessibility - environmental monitoring teams shouldn't need specialized GIS software just to check whether a protected area is being cleared. If it runs in a browser and updates itself, more people actually use it.
02 The Challenge
The existing process relied on manually pulling and reviewing satellite imagery on a fixed schedule, which meant deforestation events could go undetected for weeks - long enough for meaningful damage to occur before anyone noticed. There was no single place to see change over time; each review started from scratch.
03 Our Solution
We designed and built a Python-based ingestion pipeline that pulls satellite imagery on a recurring basis, runs automated change detection against a stored historical baseline, and writes the results into a PostGIS-backed spatial database. A lightweight web dashboard (Python, HTML/CSS) sits on top, rendering flagged regions on an interactive map with time-based filtering so analysts can see exactly when and where change occurred.
04 Results & Impact
Project Details
- Category
- GIS & Geospatial
- Client
- Environmental Research Lab (Confidential)
Technologies Used
Related Projects
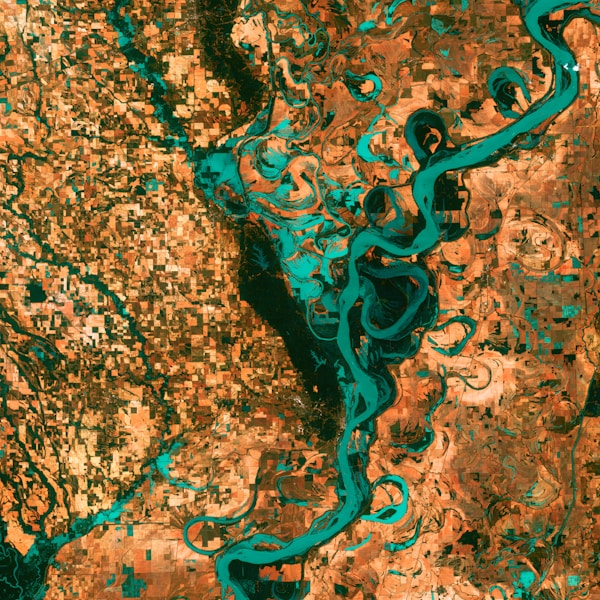
Land Use/Land Cover Mapping with Google Earth Engine
Large-scale Land Use/Land Cover classification built on Google Earth Engine, turning raw satellite imagery into actionable land-cover maps for environmental monitoring at regional scale.
Read case study →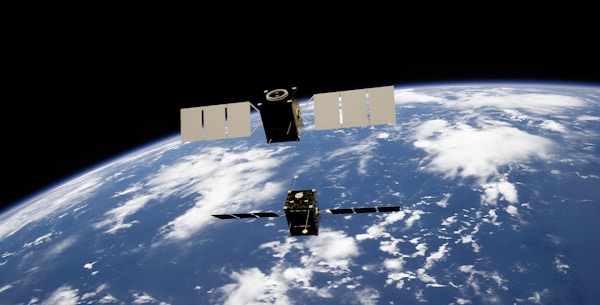
Geo-Forensics: Satellite Imagery Analysis for Policy Support
Geo-forensics analysis combining satellite imagery timelines with GIS overlays to give policymakers verifiable, ground-truthed spatial evidence rather than secondhand reports.
Read case study →
Eco Health Monitoring: Environmental Reporting Website
A public-facing environmental reporting website built for a European diplomatic mission, turning environmental health data management into an accessible, transparent public resource.
Read case study →